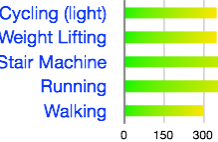
Infographic: How Many Calories Taken In vs How Many Calories Burned
Calories Taken In vs. Calories Burned by SciJourner Susan Luster Eunice Chege This work is licensed...
Infographic: Cauliflower ear
Cauliflower Ear by SciJourner Trevor Beck This work is licensed under a Creative Commons Attribution-NonCommercial-NoDerivs 3.0 Unported License
Infographic: US Heart Disease Statistics
US Heart Disease Statistics by SciJourner Brandon Clark This work is licensed under a Creative Commons...
Could C-Sections Cause Asthma and Allergies?
Babies born by Cesarean section are more likely to develop allergies and asthma by age two, according to a study presented February 26,...
Smoke Is In The Air
In elementary school, I was made fun of for coming to school smelling like smoke. My clothes kept the smell all day!...
No Pain at Any Cost?
Rheumatoid arthritis (RA) runs in my family. In 2011, at the young age of 47, I started to have the telltale signs of...
Infographic: Breast Cancer Trends
Breast Cancer Trends by Kennedi Lee This work is licensed under a Creative Commons...
Infographic: Most Common Skin Diseases in the US
Infographic: Common Skin Diseases in America by Kaylin Harris-Brown This...
Infographic: Arthritis in America
Infographic: Percent of Adults with Arthritis by Chrissy Gross This work is licensed under a Creative...


